


To Infinity and Beyond
In the second quarter of 2020 the entire country shut down and there was a sharp decline in real estate sales. It was anyone’s guess which way the market would go. The Fed lowered interest rates to stimulate the economy and it worked.
It set off a home buying spree that has pushed home prices to infinity and beyond. Even new construction sales are are moving so fast builders are having a hard time keeping up. Some have even slowed down sales, releasing just a few lots at a time. In the City of Westlake, the city Minto builders built from the ground up, there is a waiting list for the waiting list.
Looking at 2021, sales have kept pace with 2020 and prices have shot skyward. Let’s compare the numbers to see how much.
Statistics
Third Quarter 2020
- 263 Total Sales
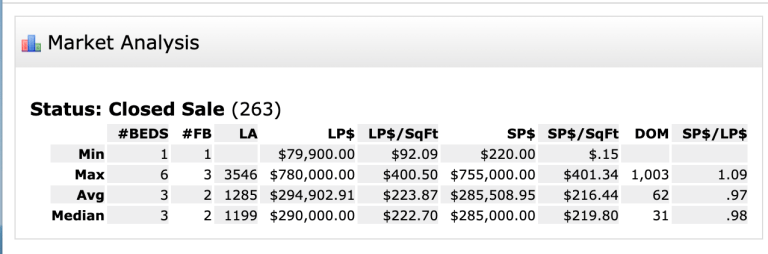
Single Family Homes and Condo Sales Stats
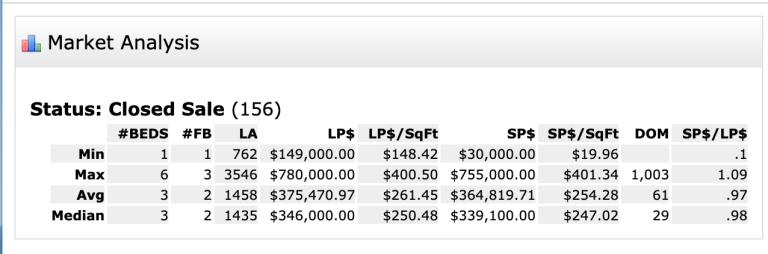
- 156 Single Family Homes Sales Stats
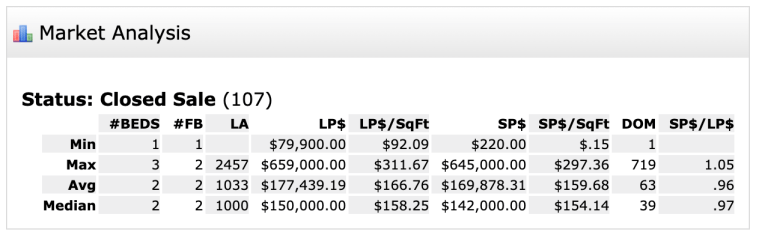
- 107 Condo/Villa/Townhouse Sales Stats
Third Quarter 2021
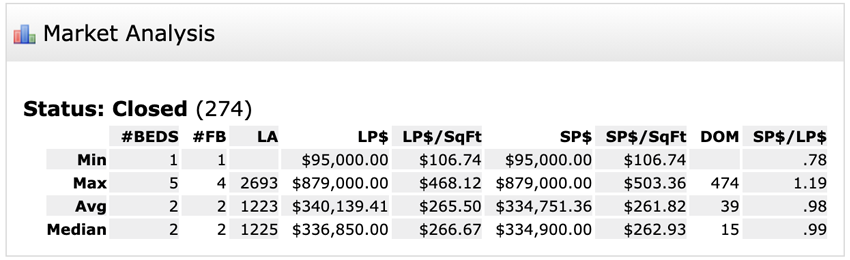
- 274 Total Sales
Single Family Homes and Condo Sales Stats
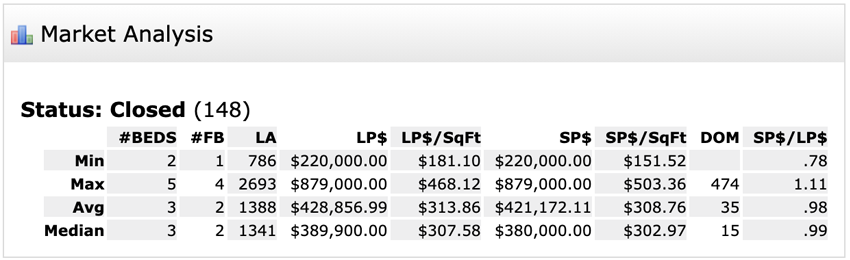
- 148 Single Family Homes Sales Stats
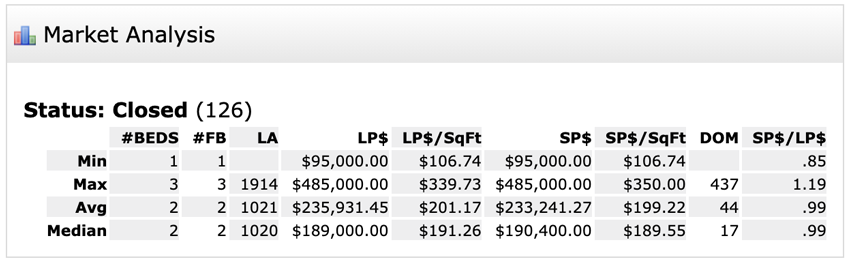
- 126 Condo/Villa/Townhouse Sales Stats
Final Analysis

As the table below illustrates the number of sales just rose 4.18%. The rise in the values of properties was much more significant. Average property values rose 17.25 %, nearly $50,000 on average. Median property values rose 17.5% or $49,900 dollars.
All Real Estates Sales in Oakland Park 3rd Quarter
| ALL SALES | # of Sales | Average Price | Median Price |
|---|---|---|---|
| 2020 | 263 | $285,508 | $285,000 |
| 2021 | 274 | $334, 751 | $334,900 |
| Y/Y Price Difference | $49,243 | $49,900 | |
| Y/Y Percentage Difference | + 4.18% | + 17.25% | + 17.5% |
Single family homes sales went down 5.13% from the 3rd quarter of 2020 but home values overall rose. Average home prices rose 15.45% or approximately $56K. Median home prices rose 12.06% or about $40K.
All Single Family Home Sales in Oakland Park 3rd Quarter
| ALL SFH SALES | # of Sales | Average Price | Median Price |
|---|---|---|---|
| 2020 | 156 | $364,819 | $339,100 |
| 2021 | 148 | $421,172 | $380,000 |
| Y/Y Price Difference | $56,353 | $40,900 | |
| Y/Y Percentage Difference | – 5.13% | + 15.45% | + 12.06% |
Condo sales went up 17.75% from 2020 to 2021. Even more significant than the rise in sales was the rise in condo prices. The average price went up a whopping 37.3% or nearly $63K. The median price went up 34.10% or about $48K.
Condo Sales in Oakland Park 3rd Quarter
| ALL CONDO SALES | # of Sales | Average Price | Median Price |
|---|---|---|---|
| 2020 | 107 | $169,878 | $142,000 |
| 2021 | 126 | $233,241 | $190,400 |
| Y/Y Price Difference | + $63,363 | $ 48,400 | |
| Y/Y Percentage Difference | + 17.75% | + 37.30% | + 34.10% |
From 2020 to 2021 the upward trend of home values continues to be strong, even though single family homes sale dipped a little. Overall values rose over 17% but the most significant gains where in condo values that rose over 37% on average and 34% on median. Are real estate prices moving to infinity and beyond? It seems so but only time will tell if the market will continue to move upward. Stay tuned!
Sales at Oak Tree
For an update on home sales at Oak Tree, not included in this report because they are not in the MLS, click here.